In maths in year 3 this week we have been looking at statistics.
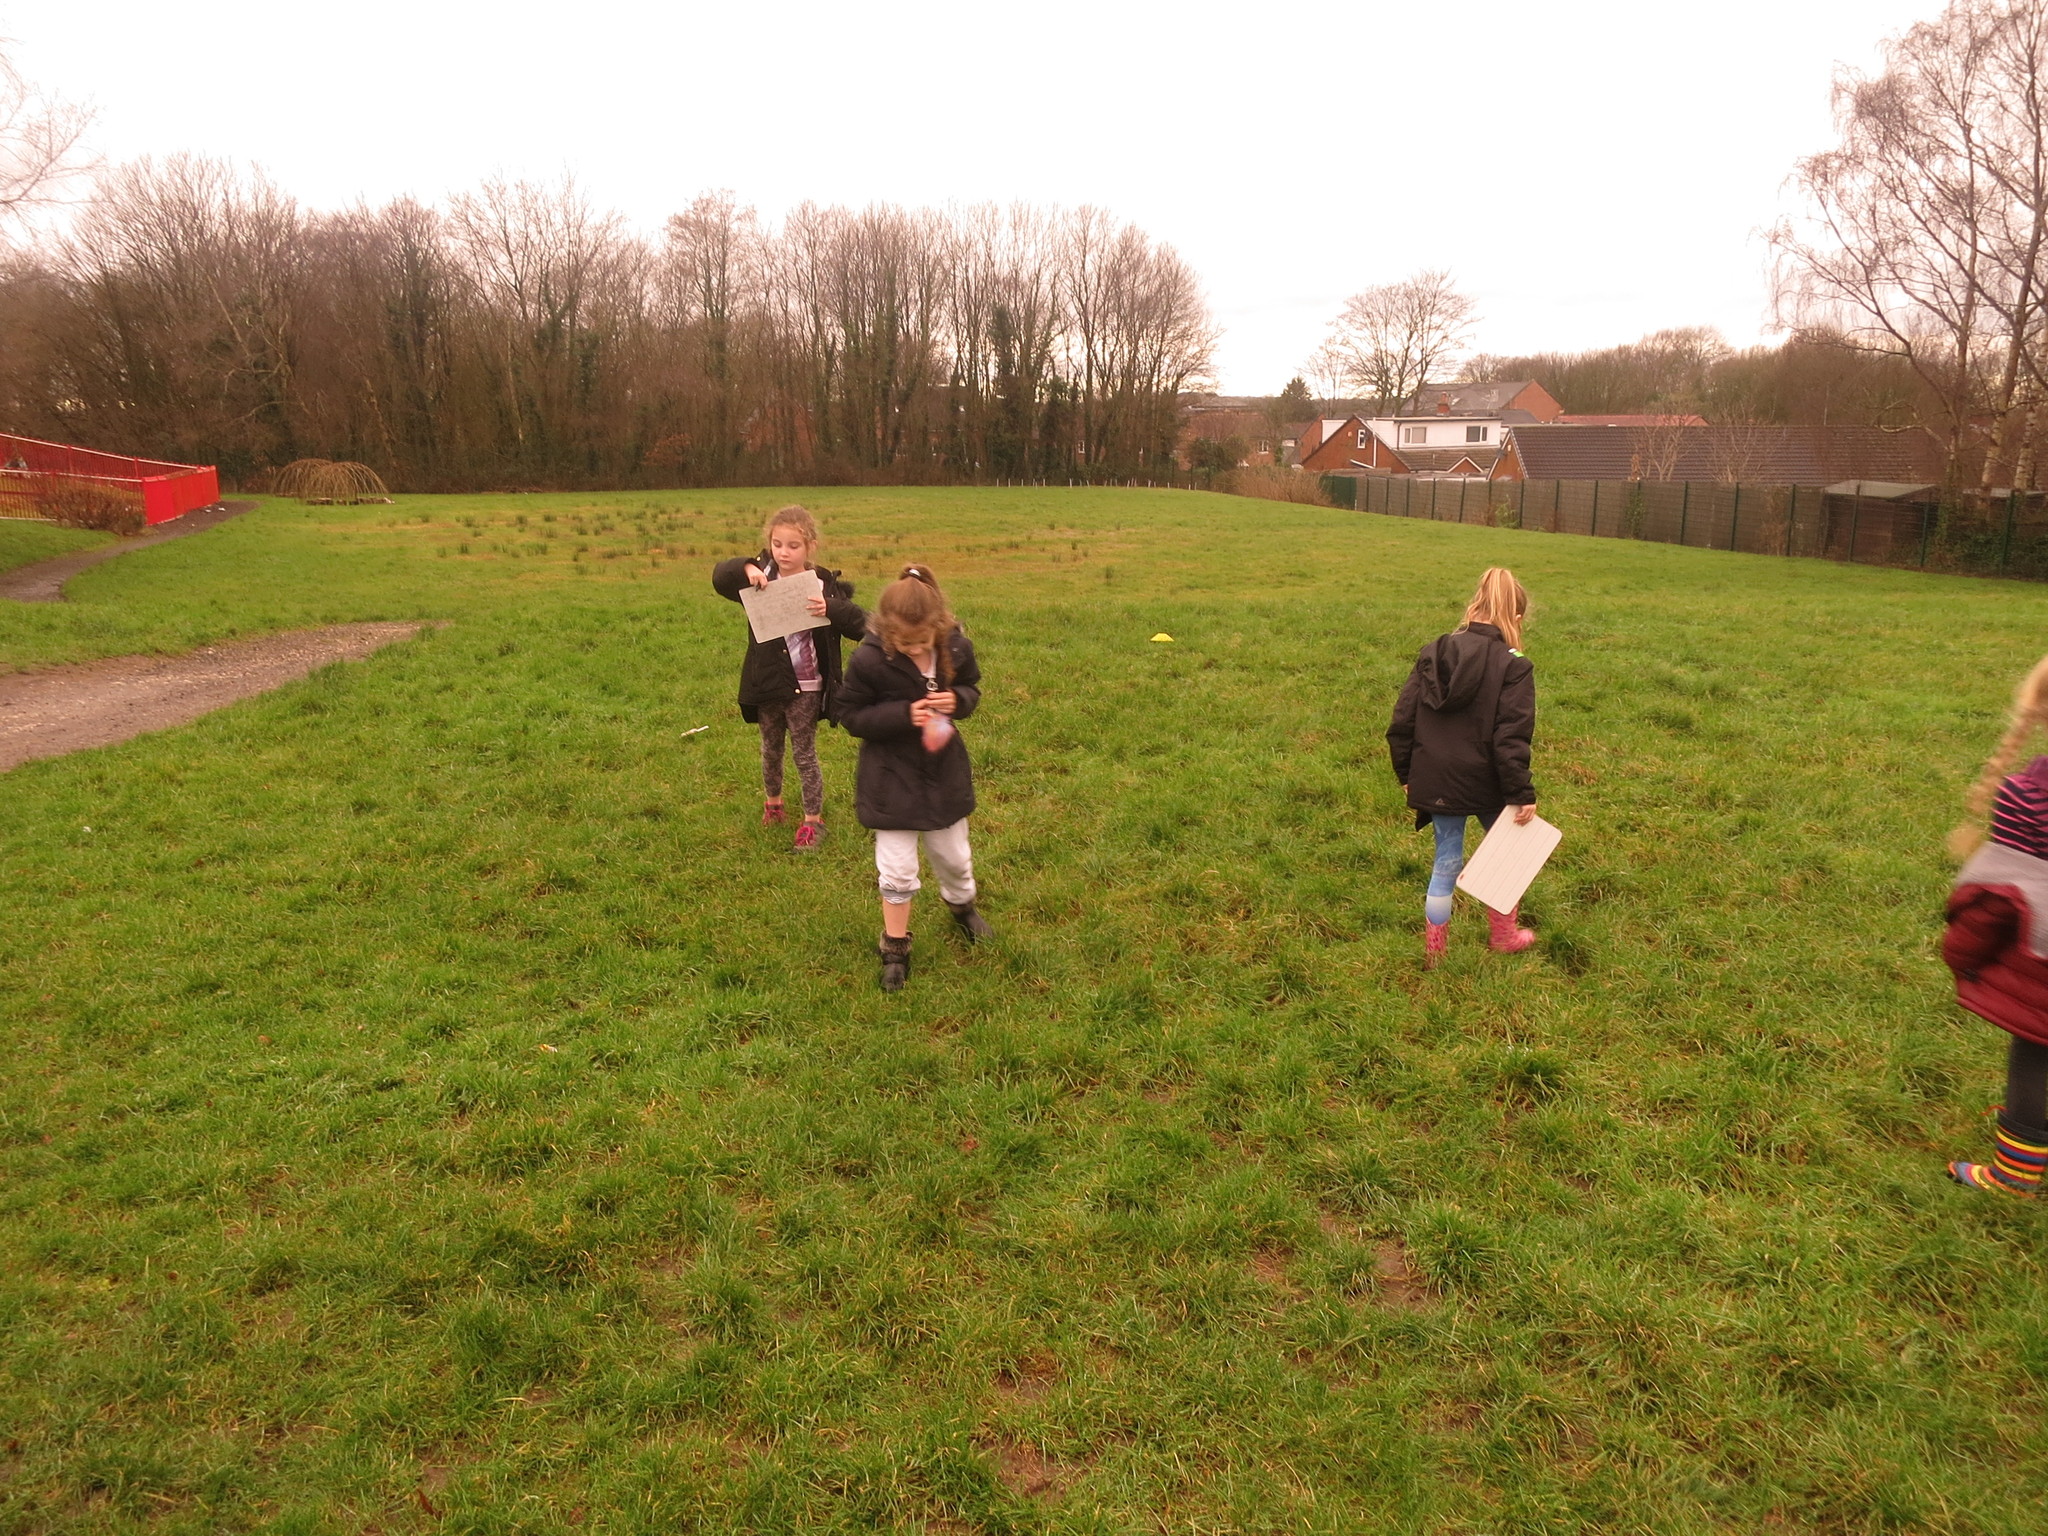
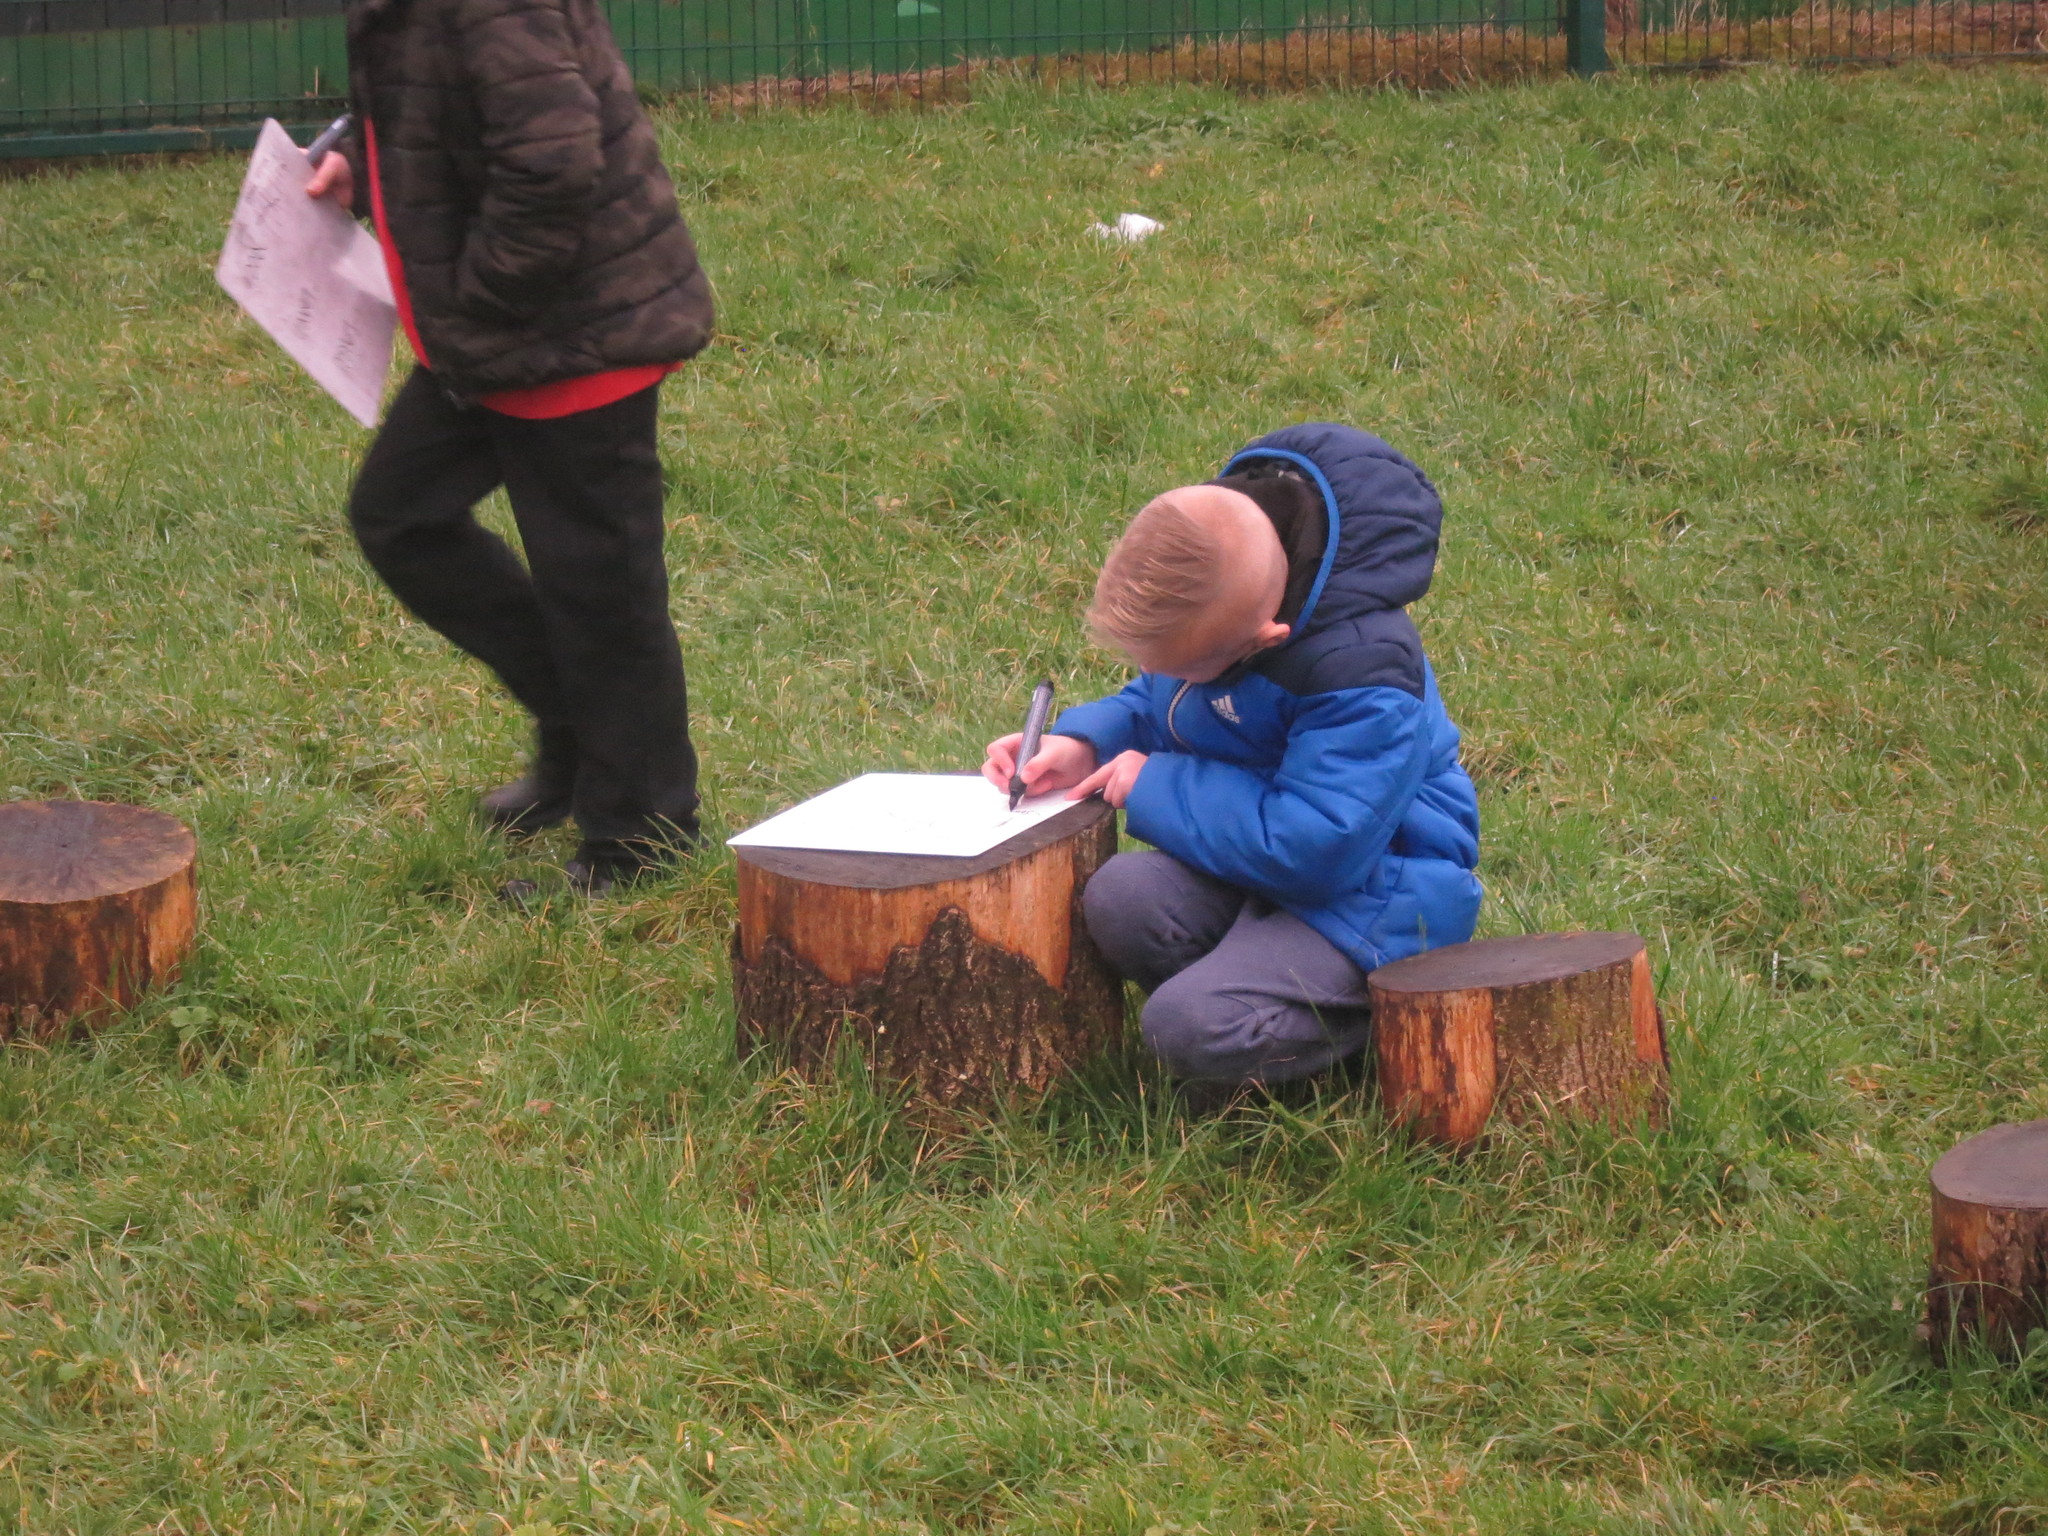
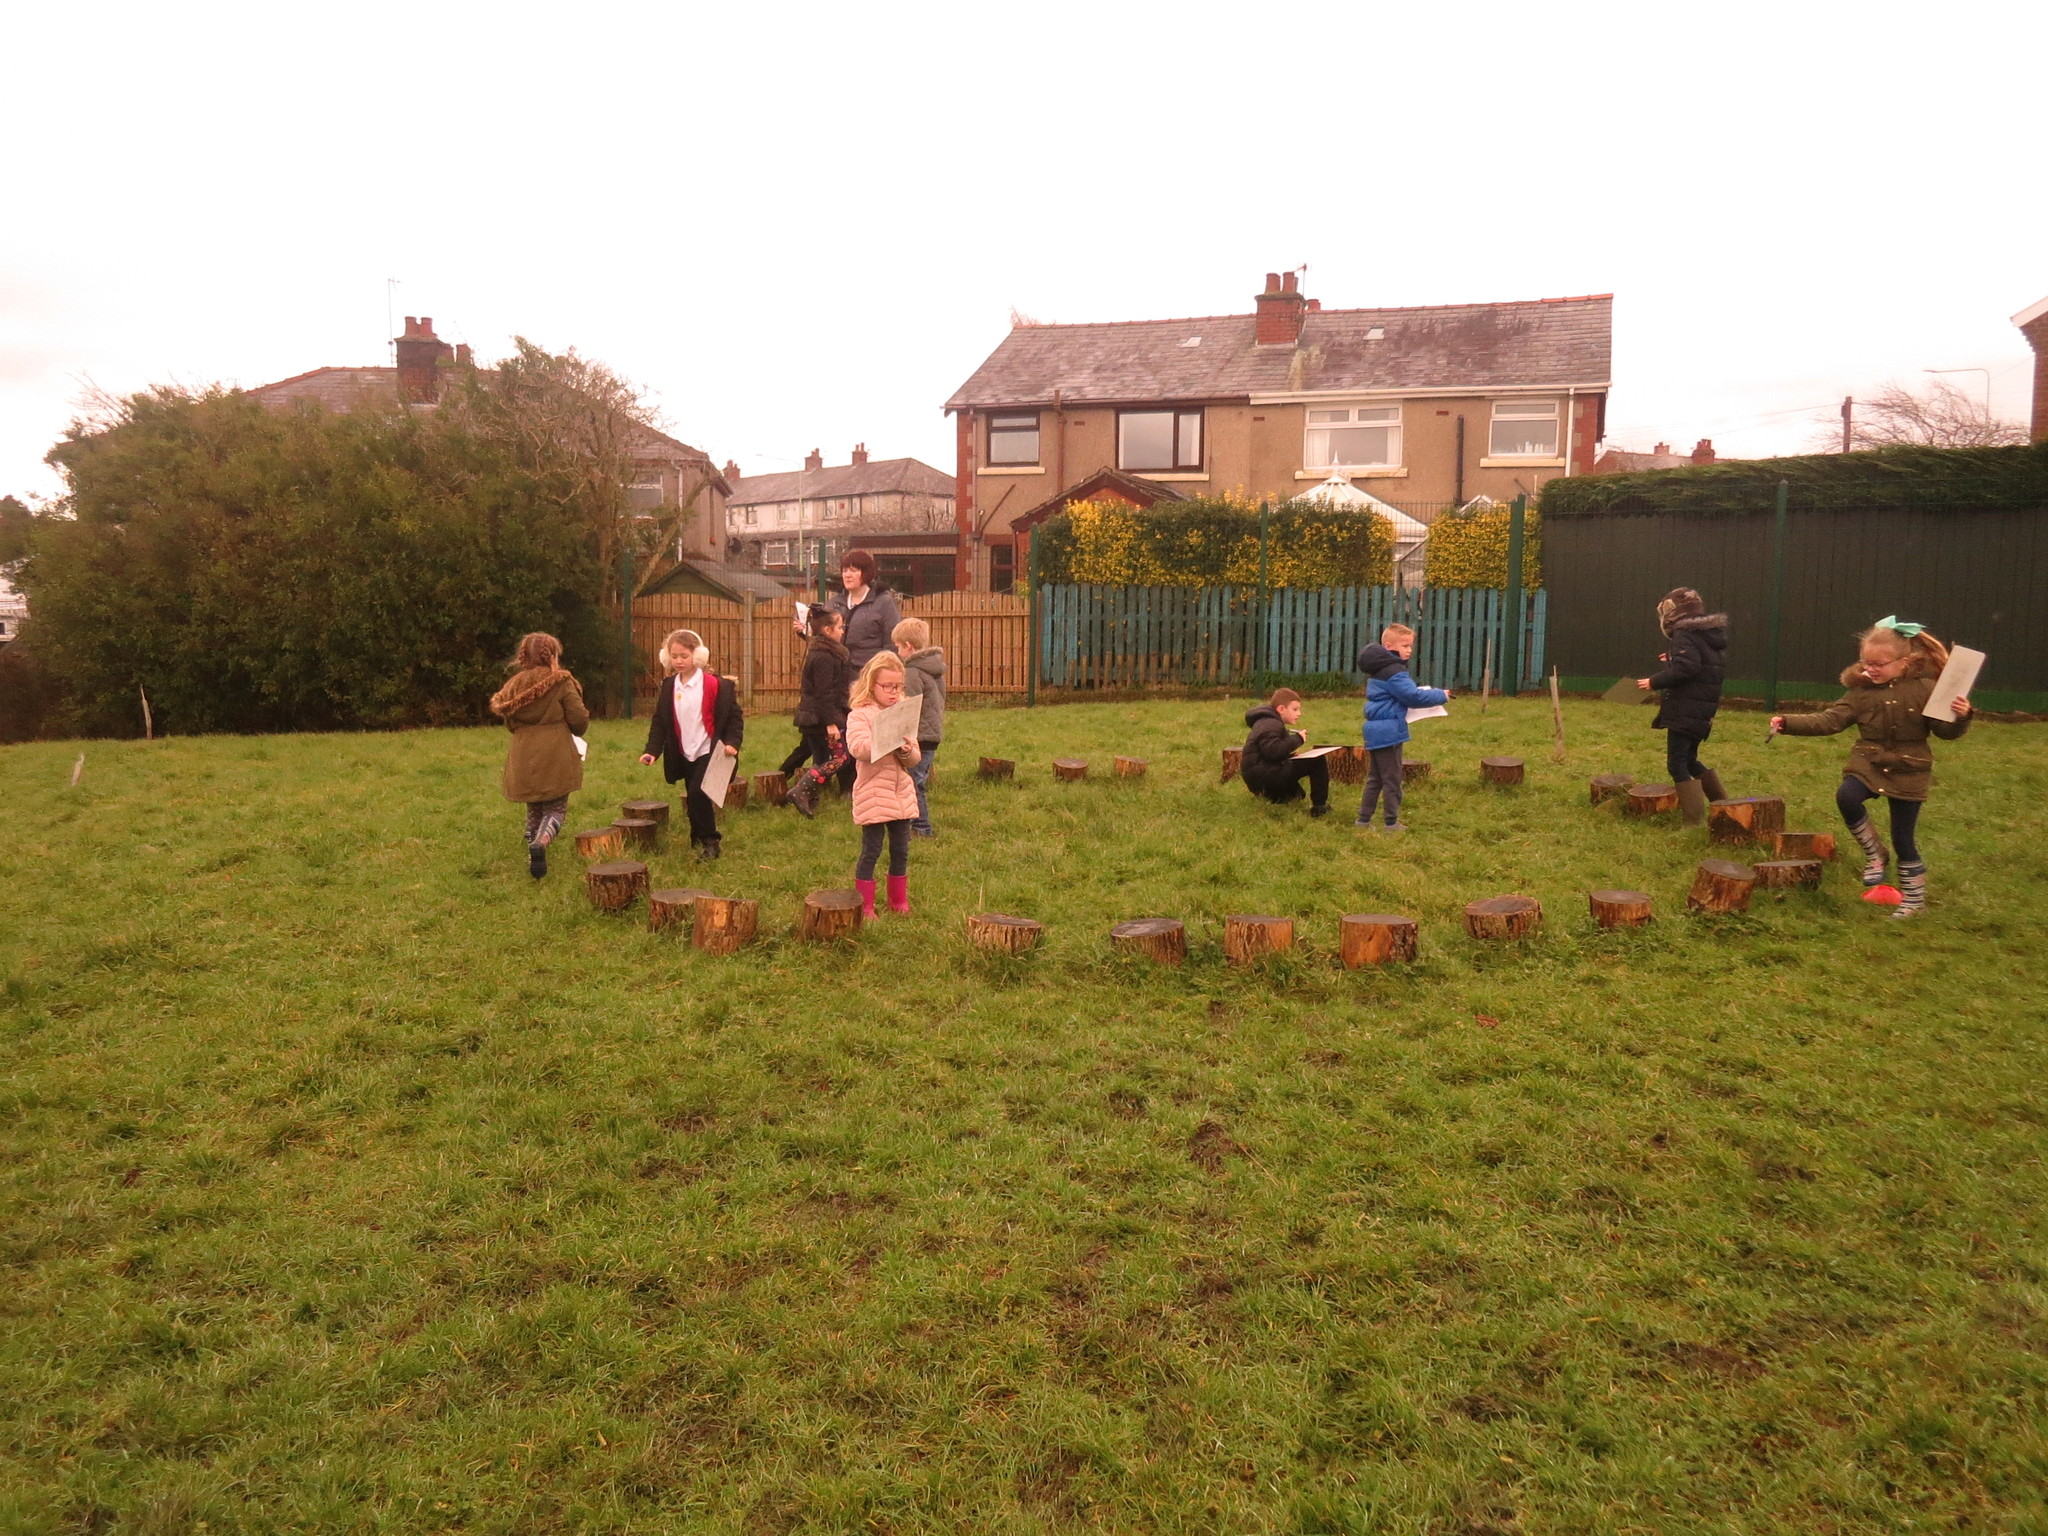
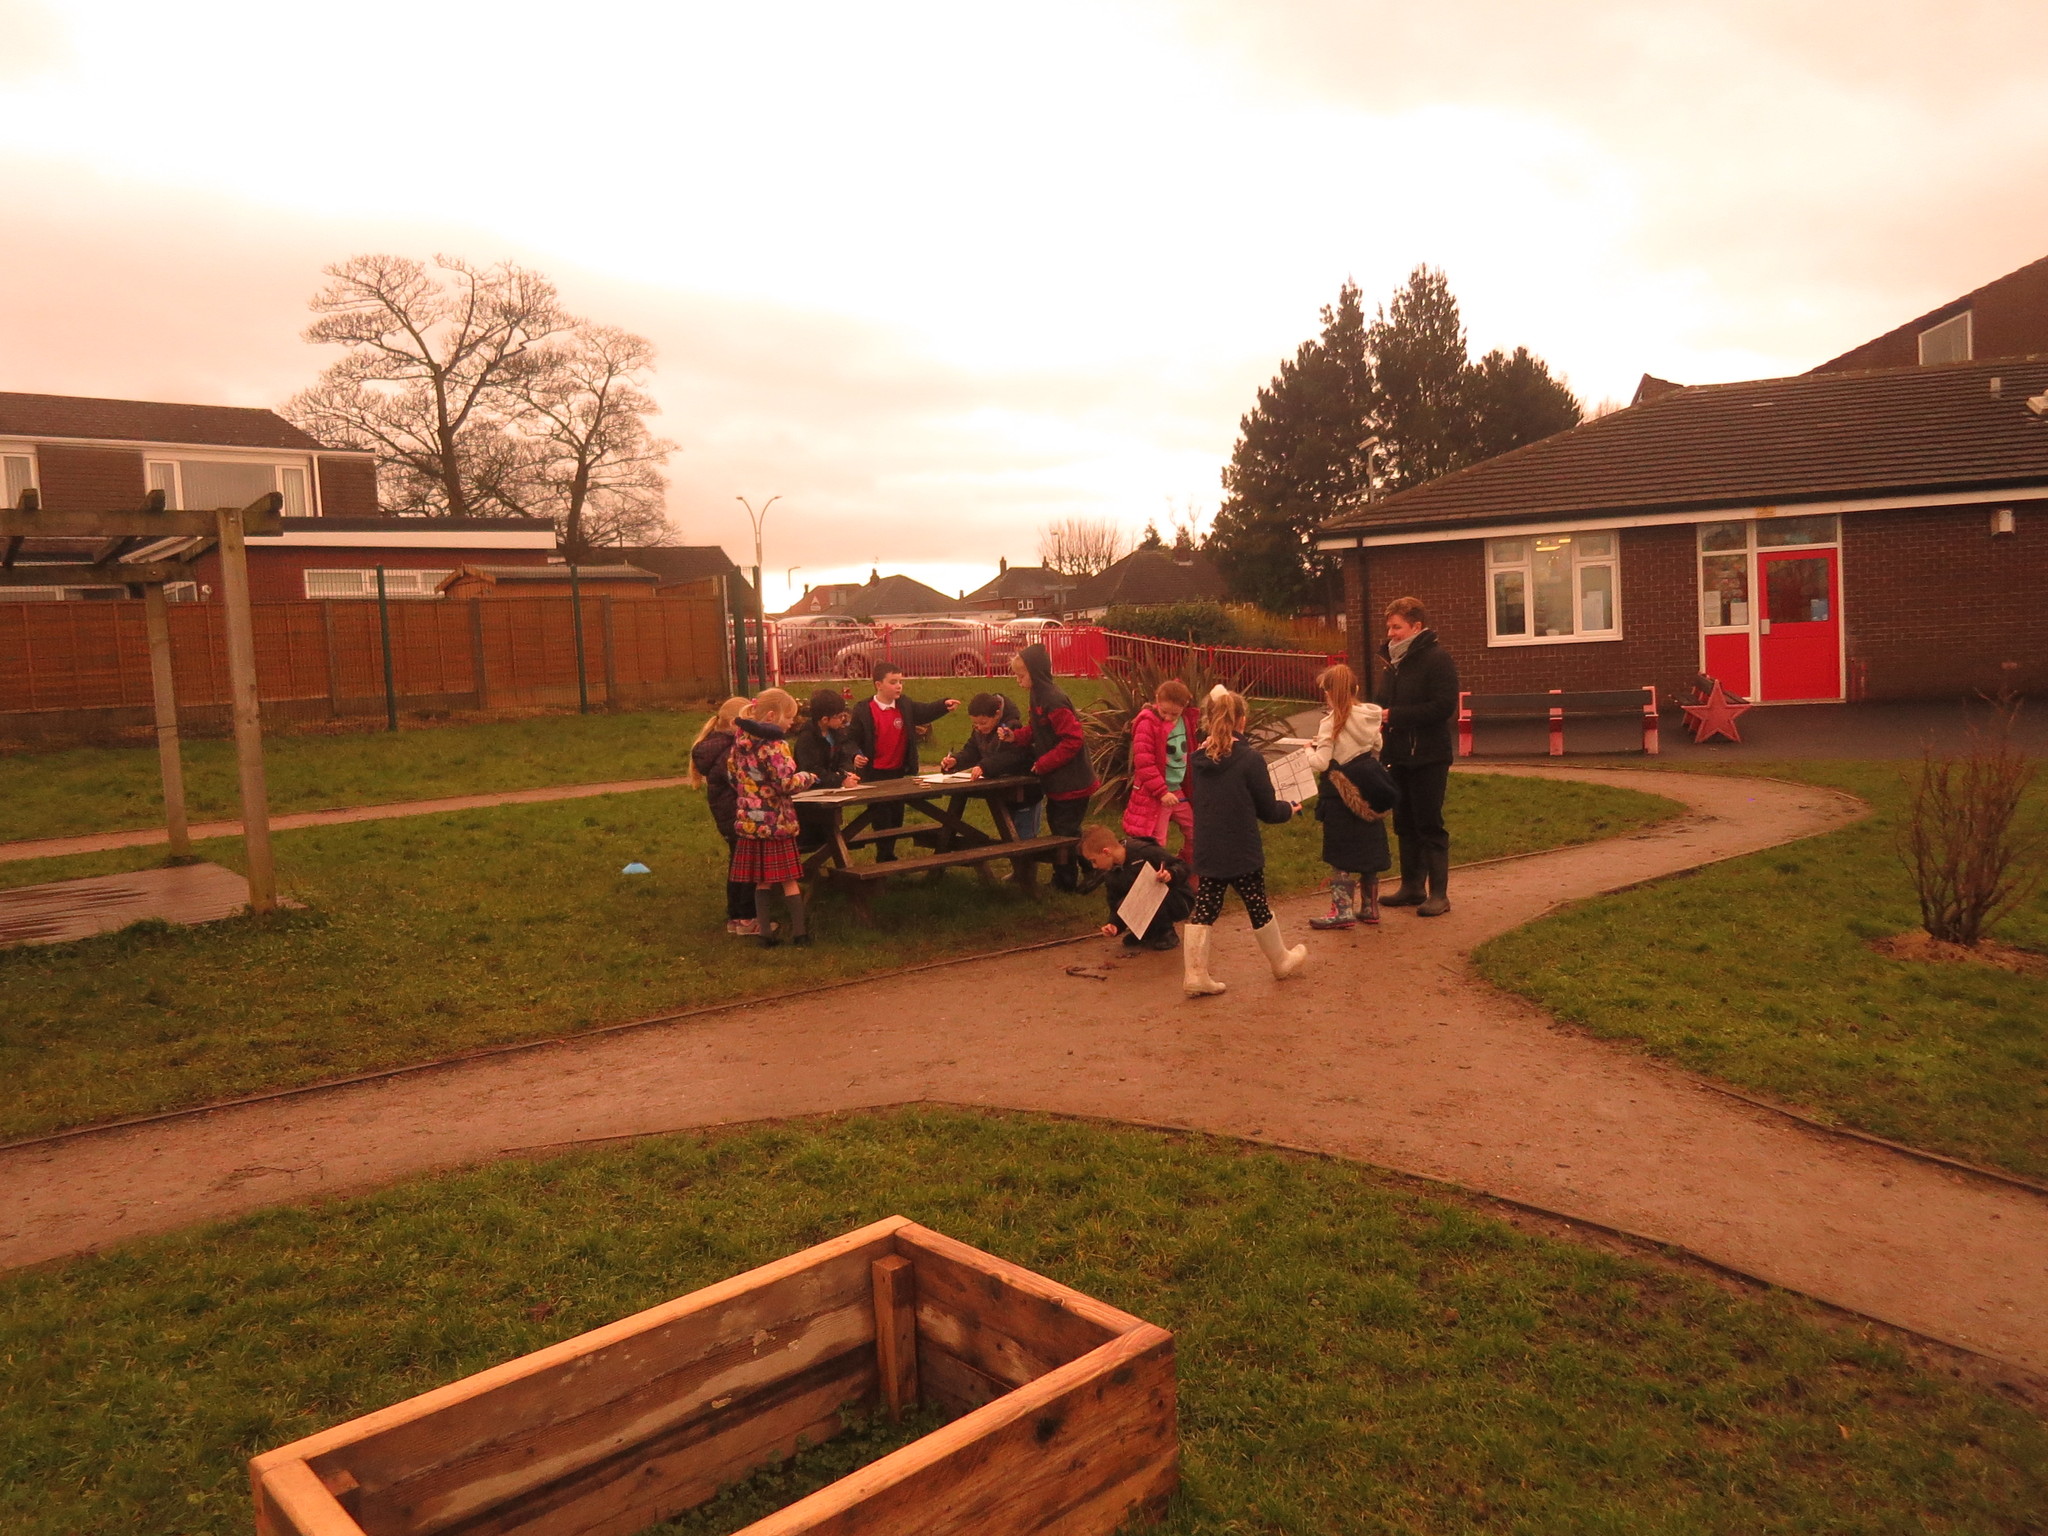
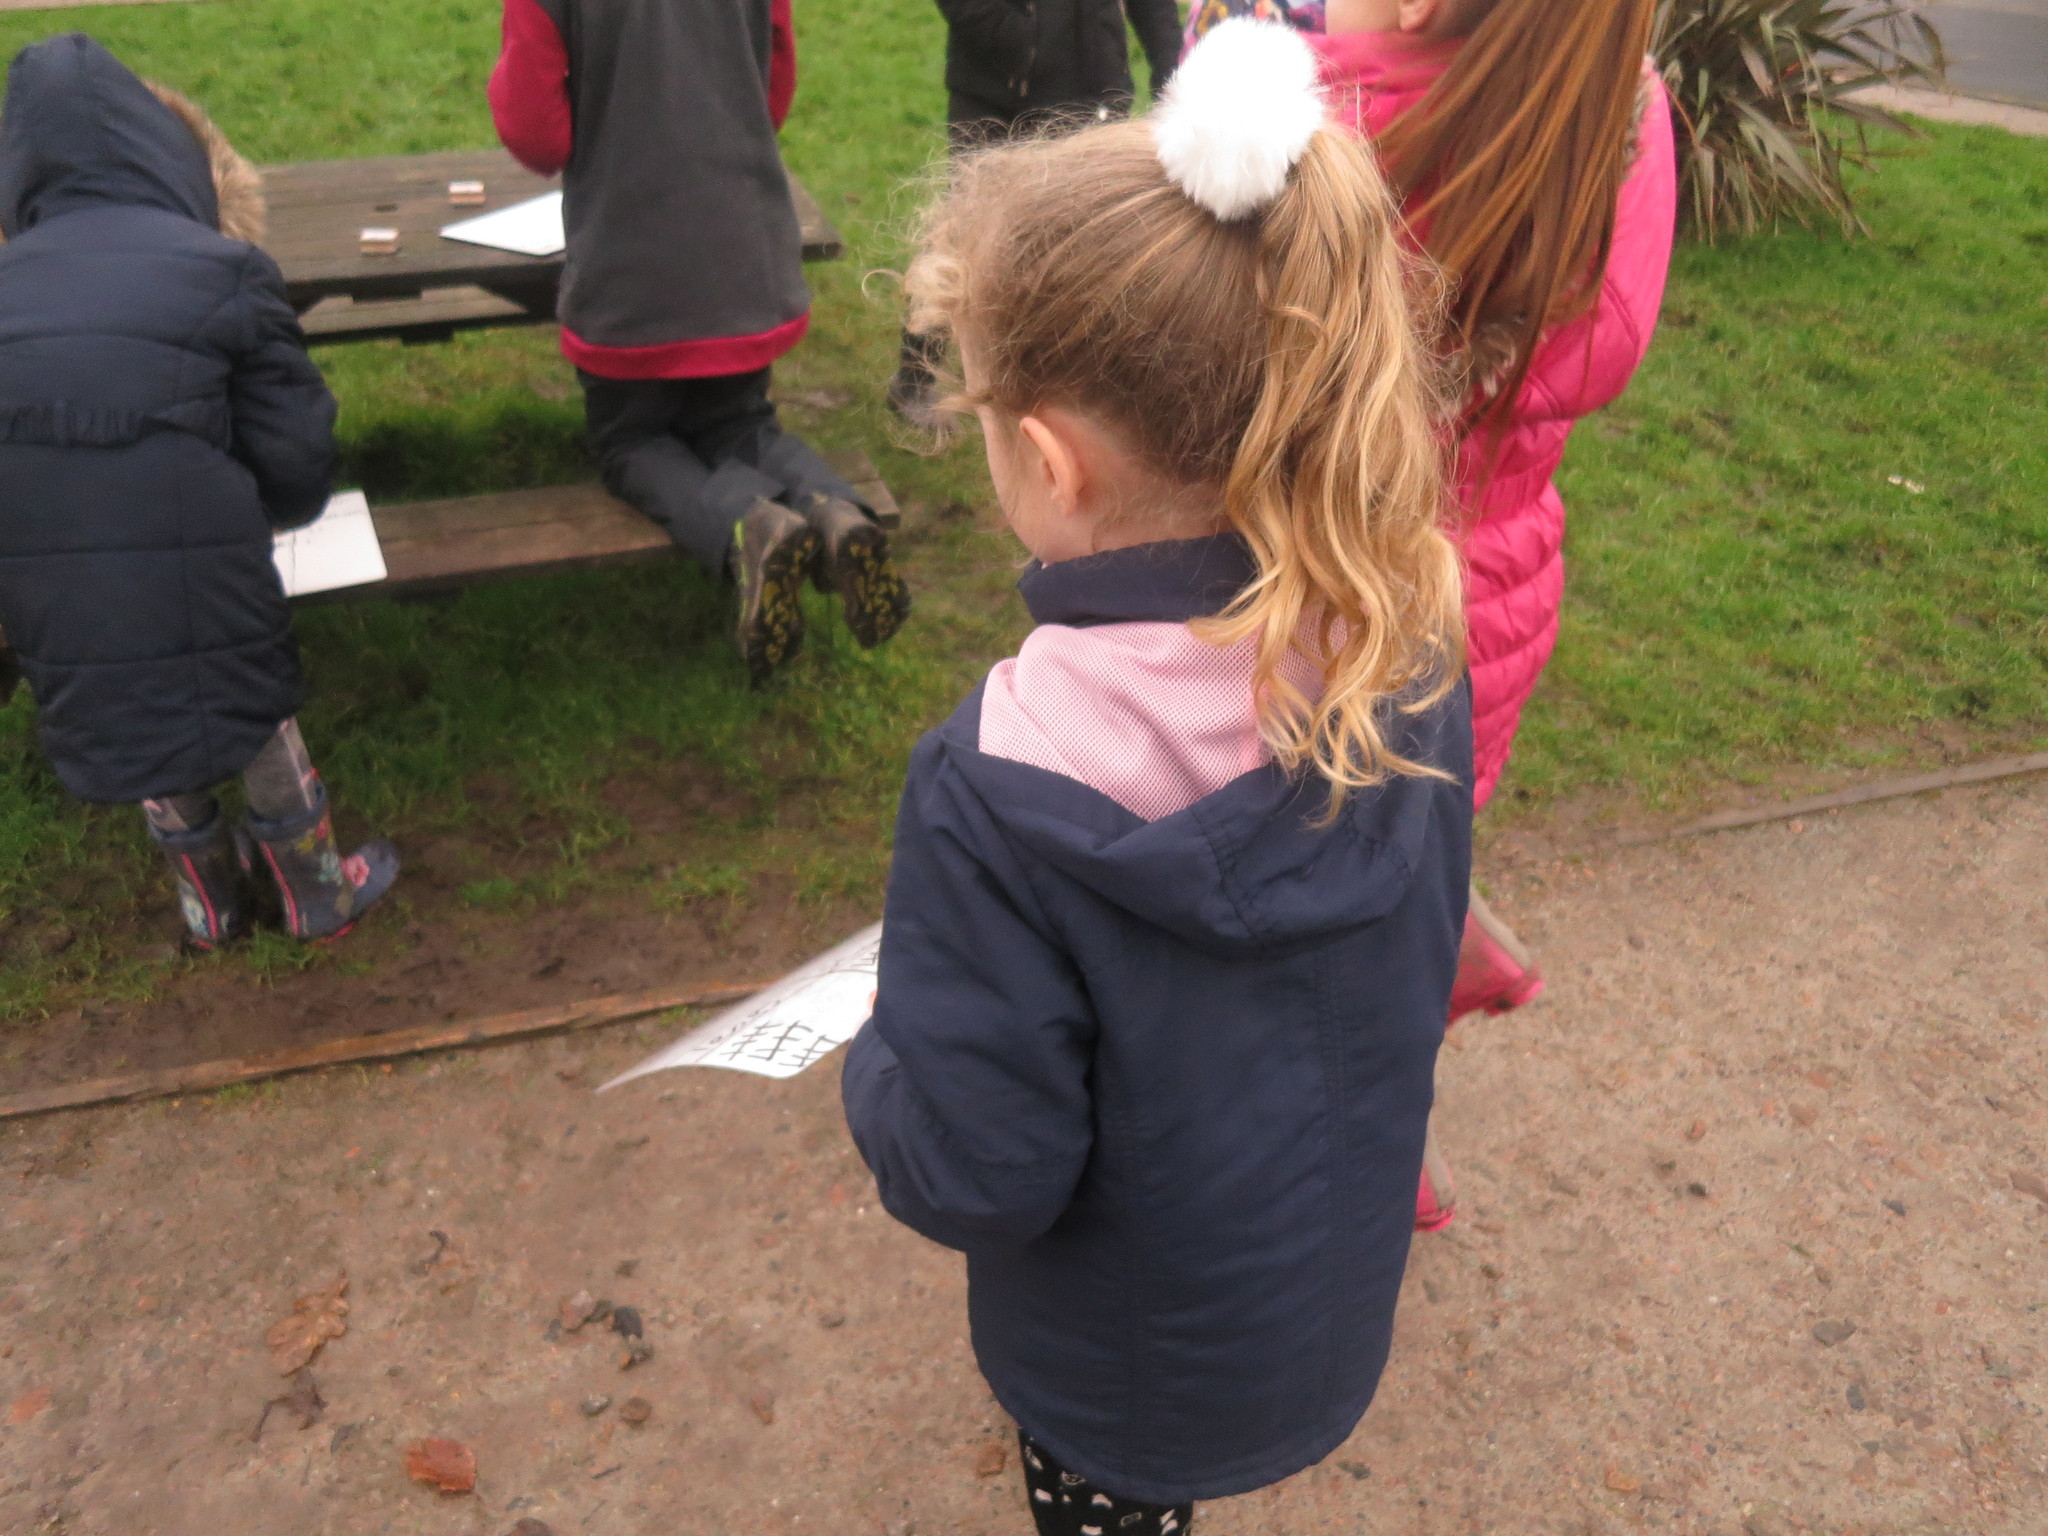
We put on our wellies and outdoor clothes so we could go and collect the data we would look at in class for our lessons.
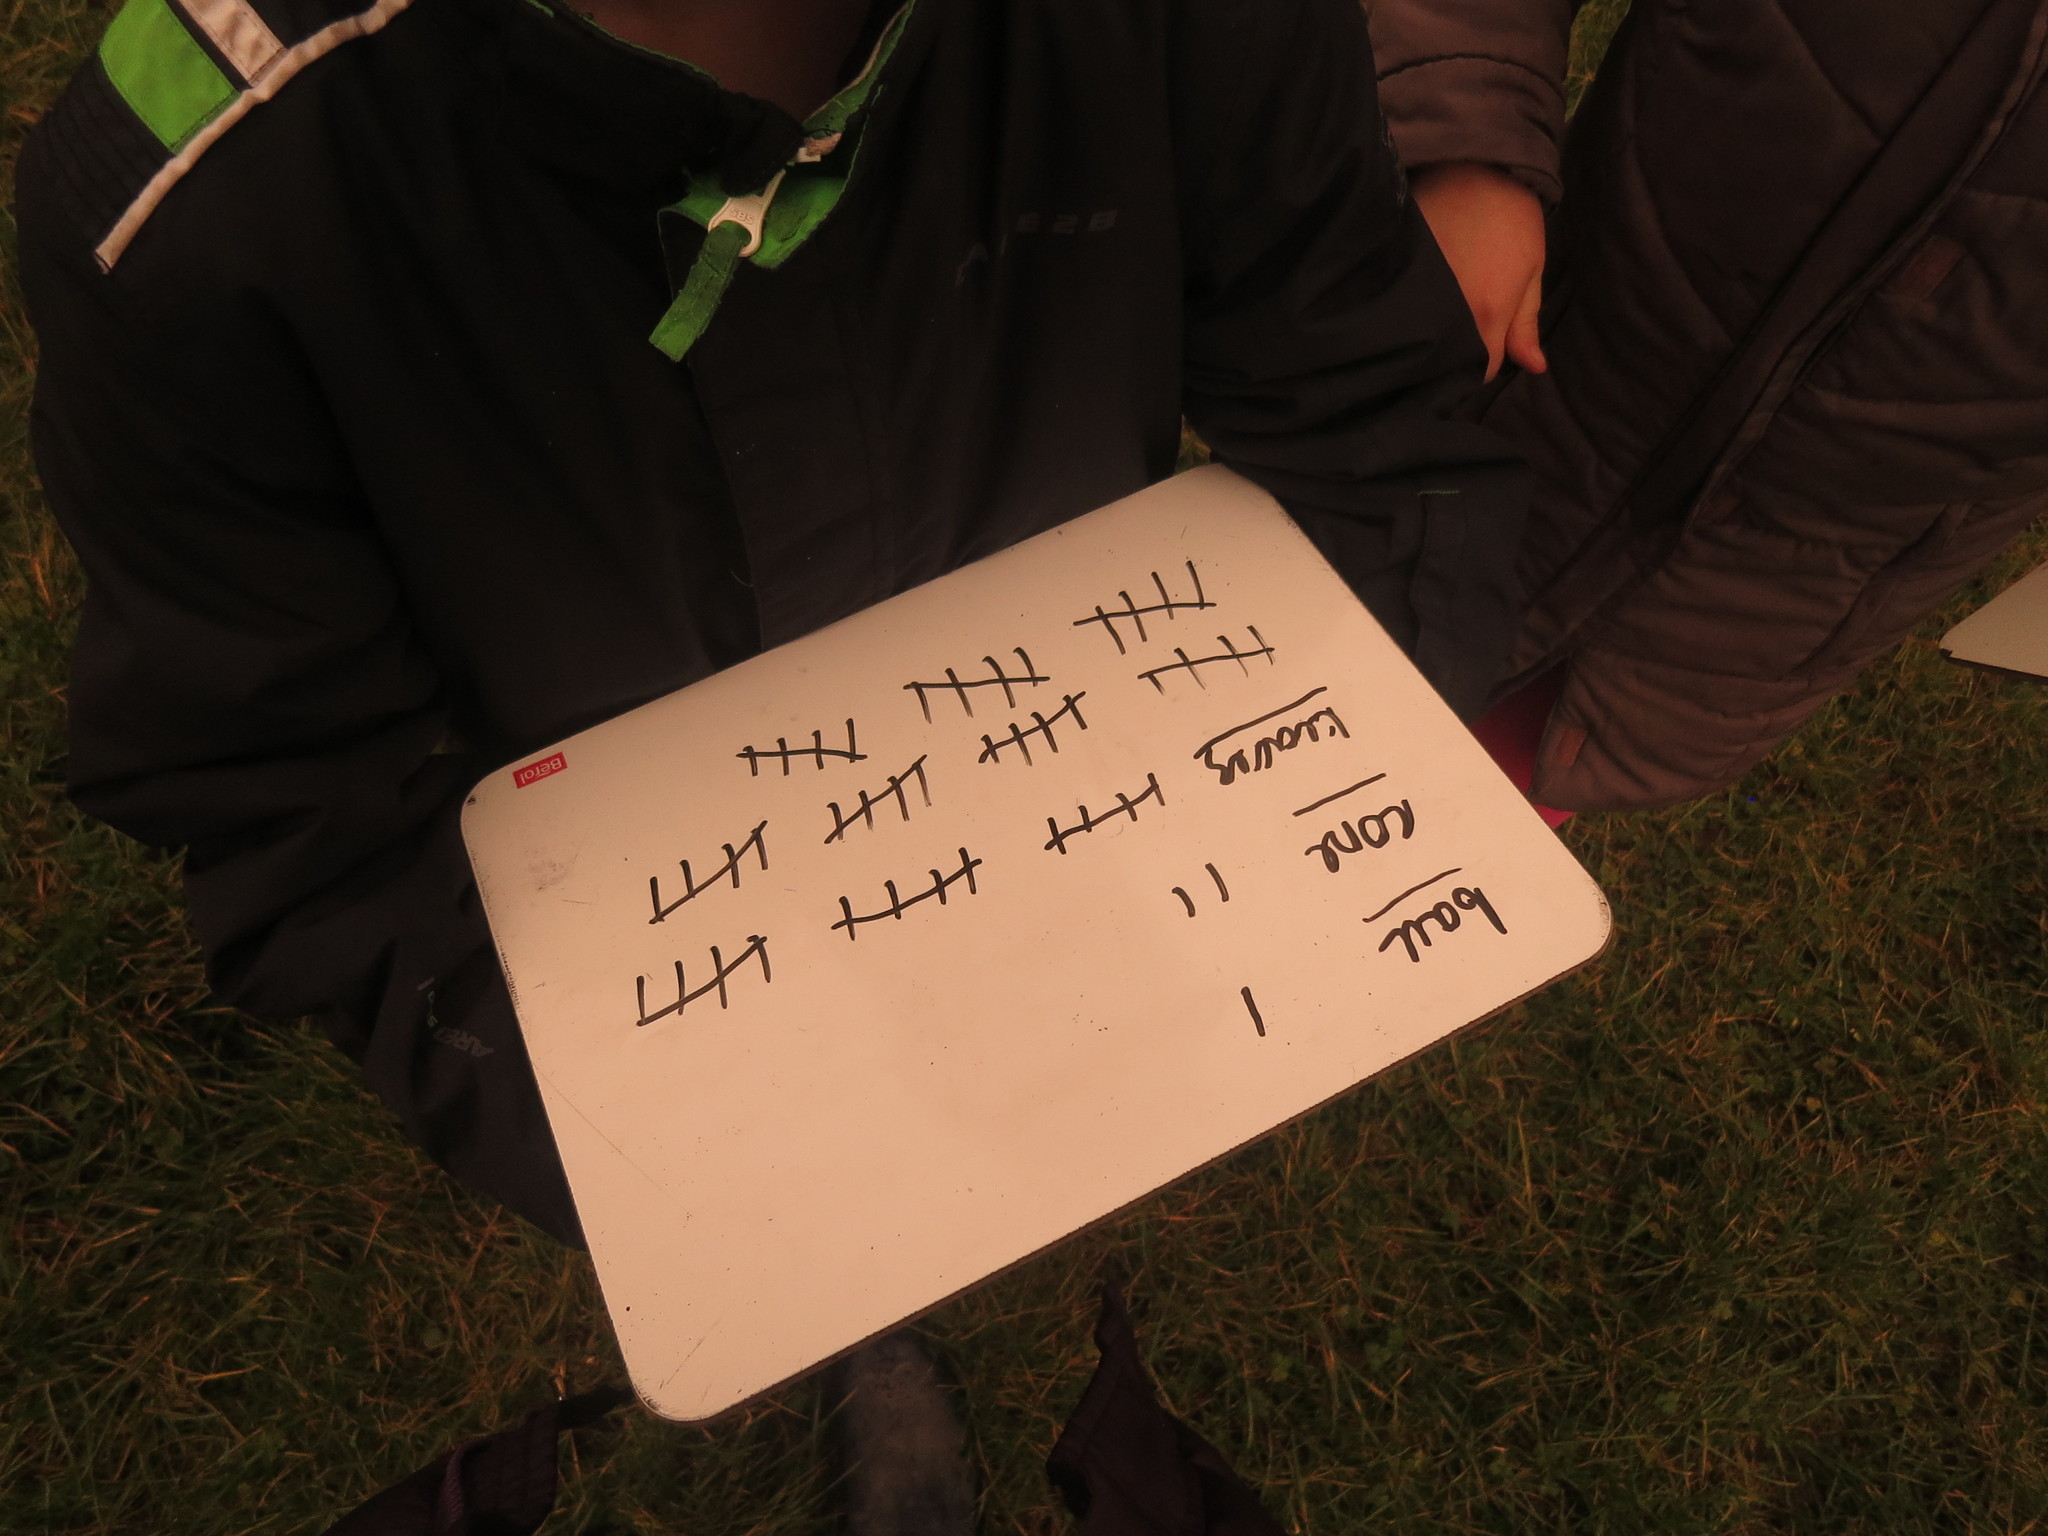
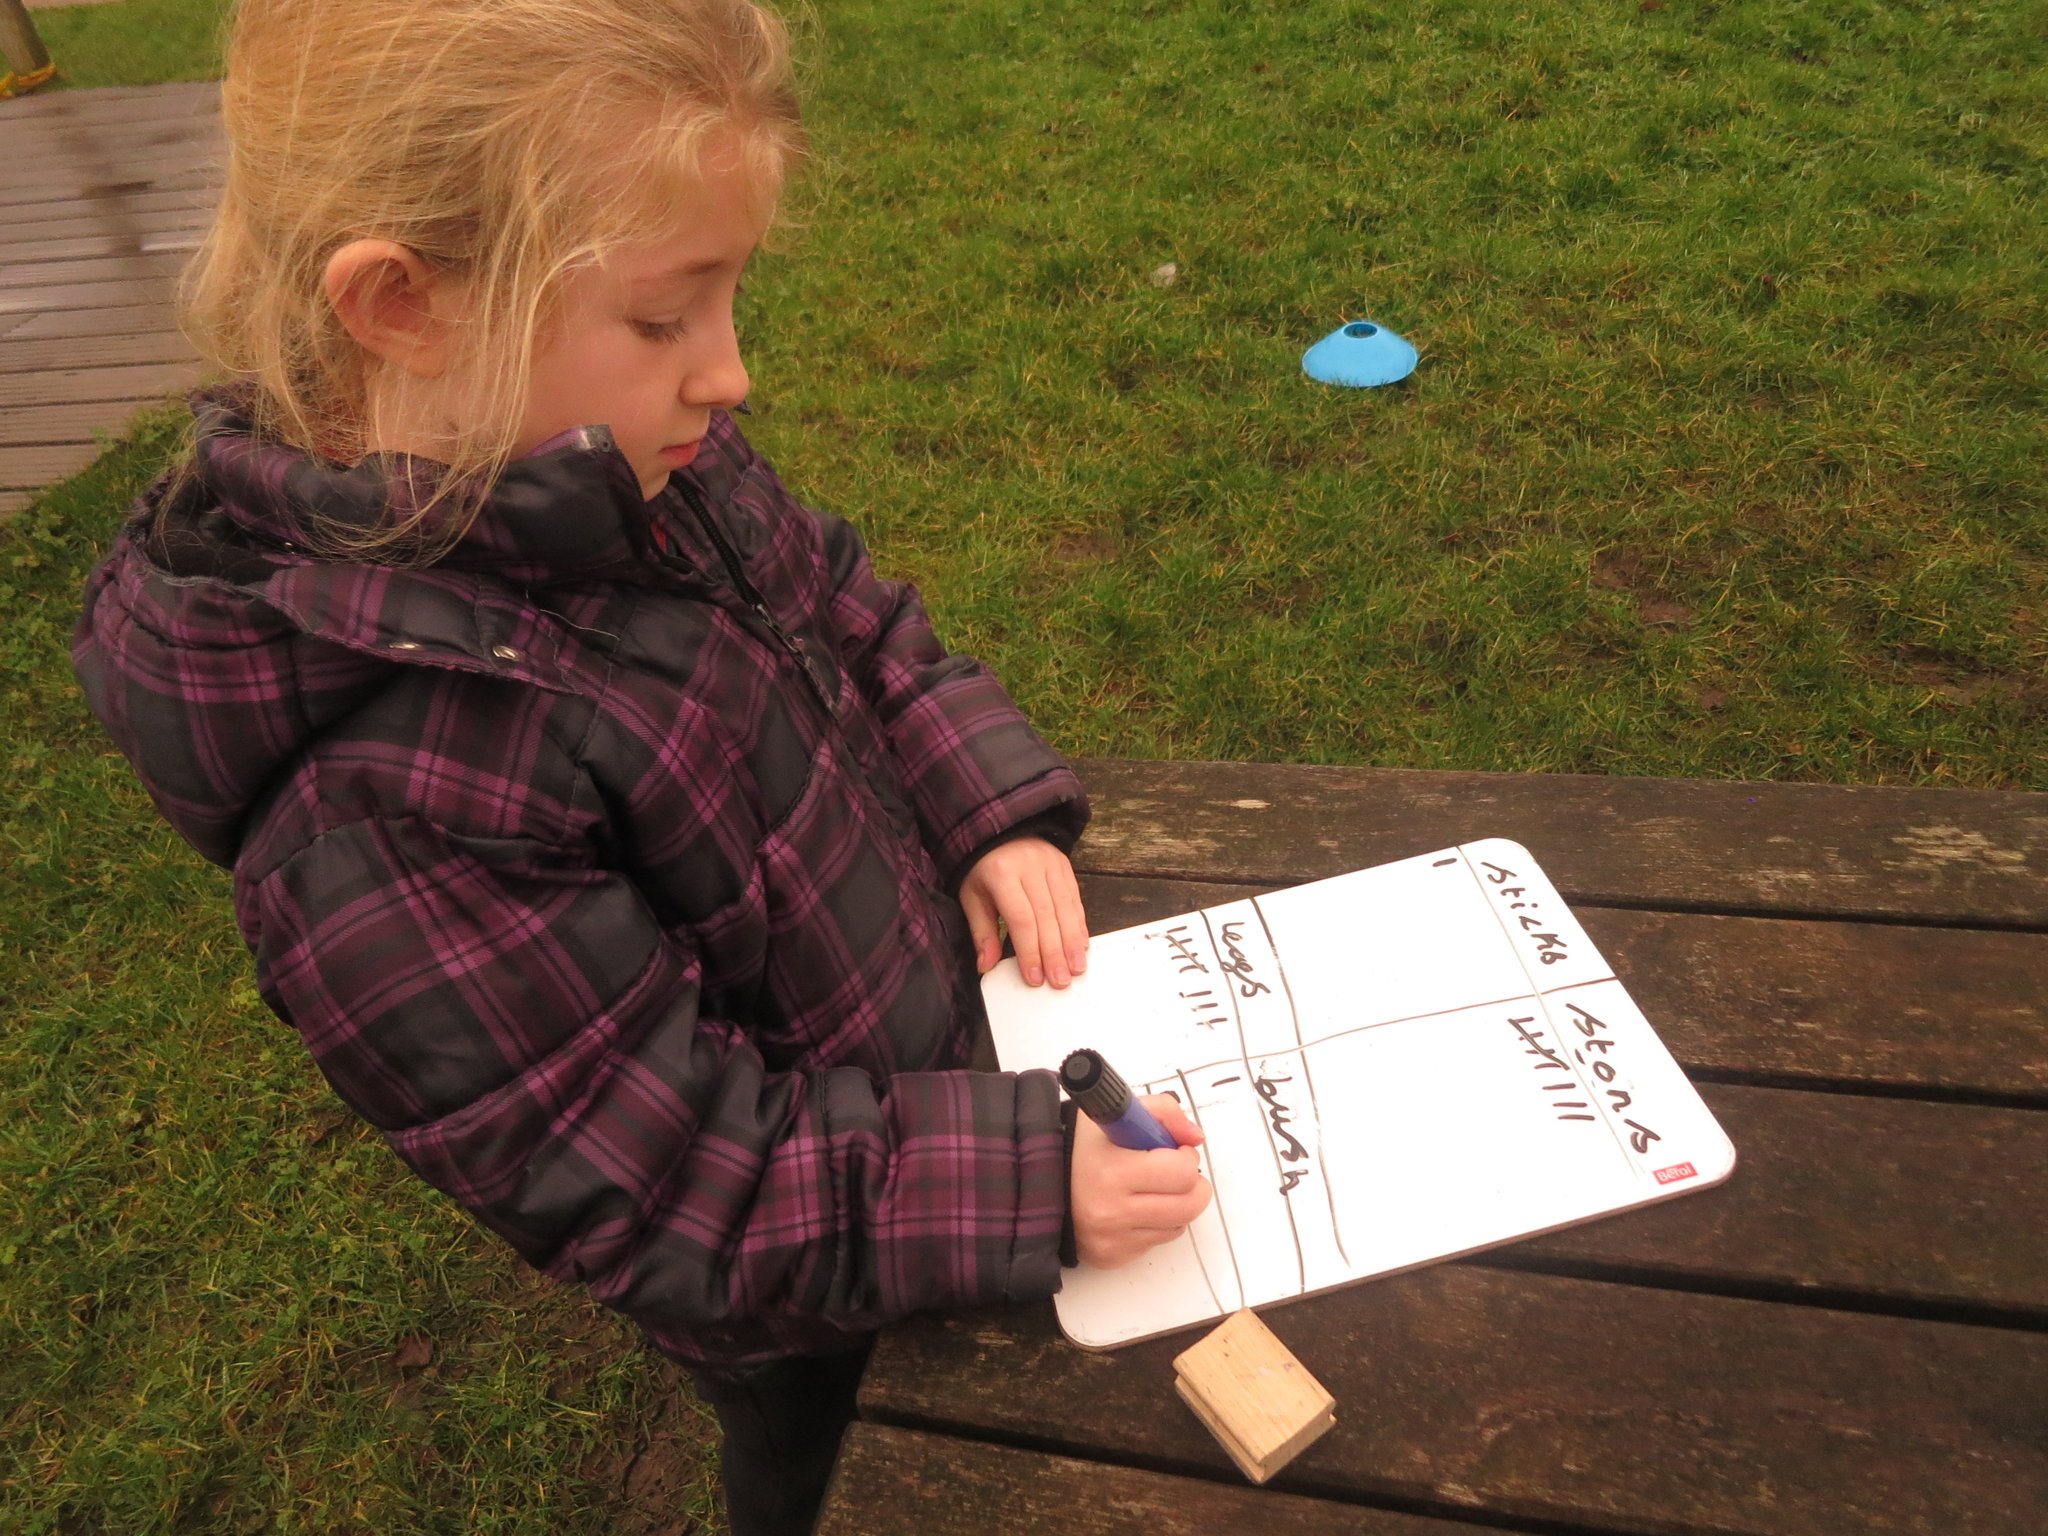
We made tally charts of what we found in specific areas of the school grounds. We then used these to make pictograms and bar graphs before answering questions on what these graphs showed us.
year 3 outdoor maths